How to Fix AI Build Failed Logs: A Step-by-Step Guide
Iwan Efendi5 min
Learn how to effectively read build logs and provide the right context to AI when a build fails in Firebase Studio.
Collaborating with an AI partner, as I do in Firebase Studio, is a transformative experience. Development speed increases dramatically. However, there is one moment that every developer will inevitably face: that dreaded red notification. "Build failed."
Our first instinct is often to go back to the AI and say, "Hey, the build failed. Please fix it."
This is the most common approach—and also the least effective. Telling an AI that a build failed without providing context is like telling a doctor, "I'm sick," without describing the symptoms. The AI might guess, but those guesses are often wrong and waste time.
This article will guide you on the correct way to communicate when a build fails. It is the most important skill I've learned from human–AI collaboration.
Every time you ask an AI to make changes and the build process runs, a detailed record is created behind the scenes. This record, called the build log, is a trace of every step taken to build your site.
When the process fails, the log doesn't just stop; it usually leaves behind a very important "final message." This message is the primary clue to identifying the root cause of the problem.
The next time you encounter 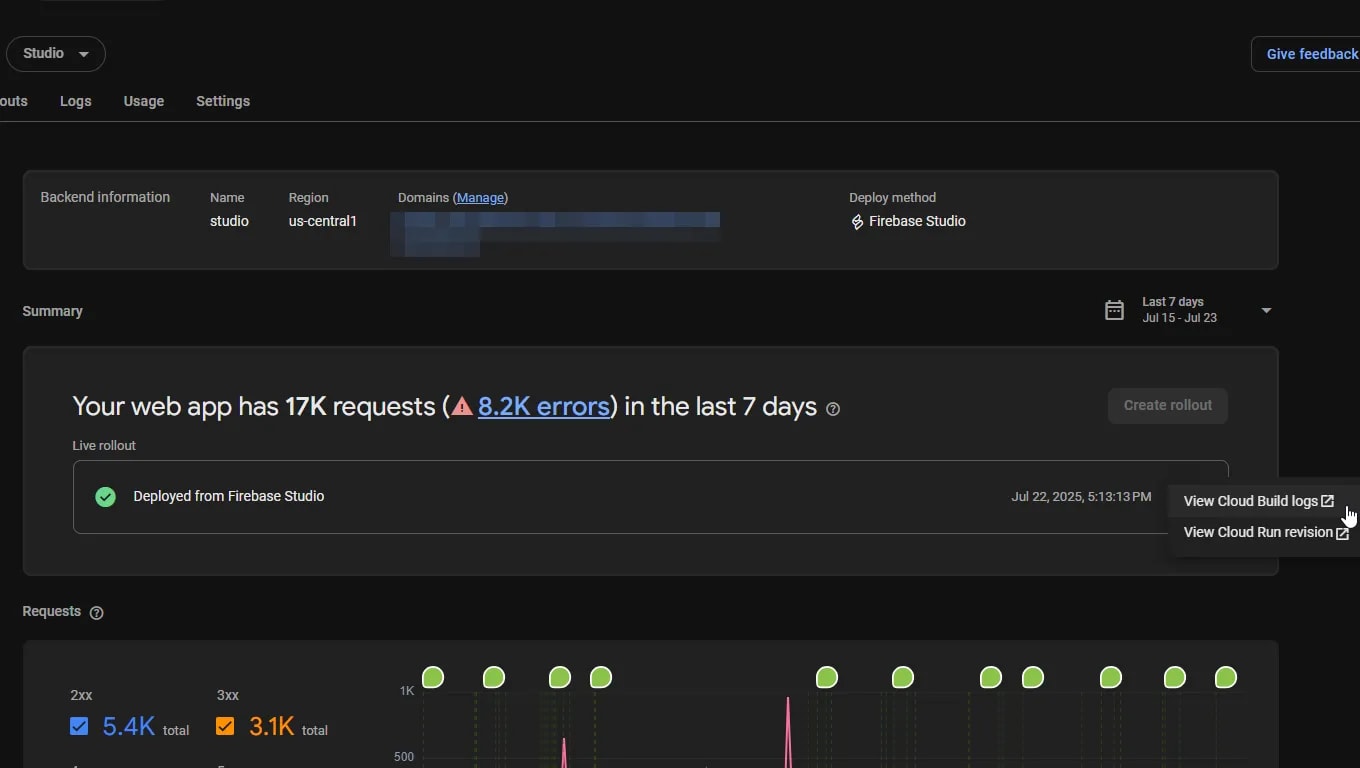 Click that button to open the log view. You'll be presented with a large amount of text, which may look intimidating at first.
 If you are working with a Next.js App Router project, some errors can be especially cryptic — for instance, when the framework serializes components in a way that is invisible to automated tools. For a deeper look at why even well-structured Next.js output can be misread, see Why AI Crawlers Can't Read Next.js App Router Sites.
To get the best results from your AI partner, follow this checklist before pasting logs:
Understanding that
If you are working with a Next.js App Router project, some errors can be especially cryptic — for instance, when the framework serializes components in a way that is invisible to automated tools. For a deeper look at why even well-structured Next.js output can be misread, see Why AI Crawlers Can't Read Next.js App Router Sites.
To get the best results from your AI partner, follow this checklist before pasting logs:
Understanding that
Q: Do I need to paste the entire build log into the AI prompt?
A: No. Pasting the full log is usually counterproductive because it floods the context window with noise. Focus on the last 20–30 lines where the fatal error is summarized. If the AI still cannot identify the problem, you can share more of the surrounding lines incrementally.
Q: What if the error message at the bottom of the log is vague, like "Process exited with code 1"?
A: Scroll up slightly from the very bottom to find the last substantive error block before that exit message. There is almost always a more descriptive
Why Are Build Logs So Important?
Step by Step: From 'Error' to 'Solution'
Build failed, don't panic. Follow these steps:
Step 1: Open the Build Logs
In Firebase Studio, after a build fails, there will be an option to view the details or logs of the failed process.Zoom
Step 2: Scroll to the Very Bottom
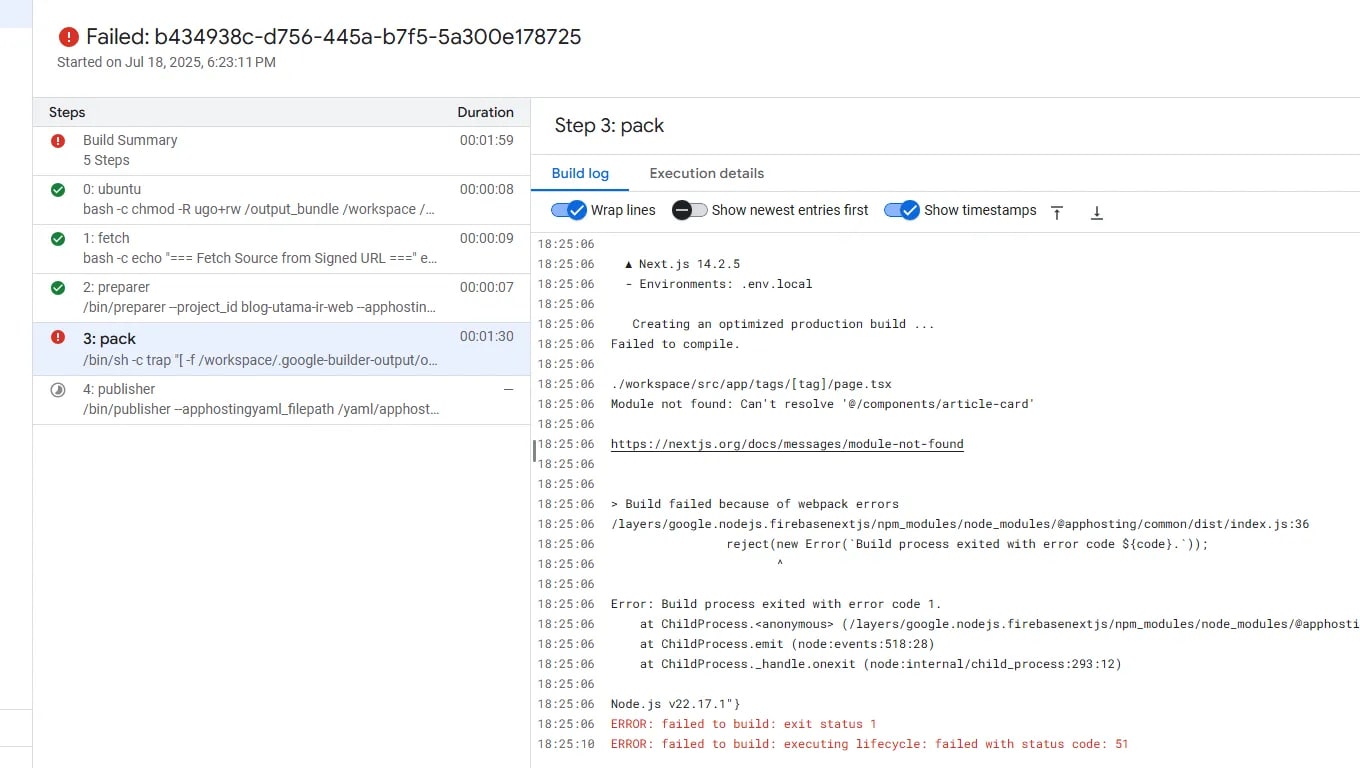
This is the most important trick. 99% of the time, the most critical information is located at the end of the log. Don't try to read from top to bottom. Scroll straight to the very end. There, you'll find the error summary that caused the entire process to stop.Step 3: Find the "Key Message"
Look for words or phrases such aserror, failed, TypeError, ReferenceError, or any message that clearly indicates something went wrong. Often, this message will point to a specific file or line of code.
Zoom
Step 4: Copy and Paste the Relevant Section
Now, instead of just telling the AI "the build failed," do this:- Copy the block of text that contains the error message. You don't need to copy the entire log—just the last 20–30 lines surrounding the main error.
- Paste that block into your prompt to the AI.
Example 1: Component Rendering TypeError
Here is an error that occurs when a property is accessed on an undefined object:"Hi, the build failed. It looks like there's an issue when rendering one of the components. Here is the last part of the log I received. Can you take a look?"This kind of targeted, component-level error is exactly the sort of thing that comes up when you build custom UI pieces from scratch. If you are curious how a real component like a sticky navigation bar is assembled and debugged iteratively, Building a Floating Pill Header with Next.js and Tailwind walks through that process end-to-end.✓ Collecting page data... - Generating static pages (5/5) Error: Failed to compile. See more info here: https://nextjs.org/docs/messages/failed-to-compile TypeError: Cannot read properties of undefined (reading 'map') at FeaturedPostCard (/src/components/featured-post-card.tsx:15:25) at ...
Example 2: Dynamic Server Usage during Static Generation
Another common failure happens when Next.js attempts to statically compile a page that uses dynamic APIs (likeheaders() or cookies()) without setting the correct config:
"Hey, the build failed during static page generation. It says dynamic server usage was triggered. How can we fix this page so it compiles correctly?"Error: Error occurred prerendering page "/notes/dynamic-preview". Read more: https://nextjs.org/docs/messages/prerender-error Error: Dynamic server usage: headers at Page (/src/app/[locale]/notes/dynamic-preview/page.tsx:8:18)
The AI Debugging Checklist
- Locate the True Error: Scroll past the generic wrapper warnings (like "Build failed") and find the specific exception (e.g.,
TypeError,SyntaxError,Dynamic server usage). - Identify the Source File: Look for file paths (e.g.,
src/components/article-card.tsx:12:4) in the stack trace. - Provide Surrounding Lines: Copy 15-20 lines before the crash to help the AI understand the build phase where it happened.
- State the Component Type: Explicitly tell the AI if the failing file is a Server or Client Component to avoid incorrect fixes.
Conclusion: A Healthy Iteration Process
Build failed is a normal part of the development process—especially in the early stages when a site is still unstable—is the first key. The second key is learning how to provide proper feedback.
By supplying relevant logs, you transform the AI's role from a "guesser" into a "knowledgeable debugging partner." This dramatically accelerates problem resolution and makes your collaboration far more productive.
FAQ
Error: or TypeError: a few lines above the generic exit code. That is the message worth sharing.
Q: Can I use this approach with AI tools other than Firebase Studio?
A: Absolutely. The principle is universal: any AI coding assistant (Cursor, GitHub Copilot Chat, Claude, etc.) benefits from receiving the actual error text rather than a paraphrase. The specific steps for opening logs differ per tool, but the copy-and-paste strategy remains the same.
Q: How do I tell the difference between a build error and a runtime error?
A: Build errors surface during the compilation or static-generation phase and prevent a deployable artifact from being produced — you will see them in the CI/CD or local next build output. Runtime errors appear only after the site is live and are usually caught in browser consoles or server logs. This article focuses on build-time errors. For runtime issues, the same "copy the relevant trace" principle applies, but you retrieve the stack trace from your monitoring tool or browser DevTools instead.
References
- Next.js — Understanding Build Errors — Official Next.js documentation on common compilation failures and how to interpret them.
- Firebase Studio Documentation — The official guide to Firebase Studio, including how to access build logs and manage deployments.
- Vercel Build Logs Guide — Vercel's troubleshooting reference for reading and acting on build output, applicable to any Next.js project.
- Why AI Crawlers Can't Read Next.js App Router Sites — A related SnipGeek article explaining how the RSC wire format can create unexpected behavior invisible to both AI tools and automated crawlers.
Topics
Topics in this note
Explore related ideas through the topics connected to this note.
Share this article
Discussion
Preparing the comments area...